
Exploring Data Analysis with Excel: From Basics to Insights
Microsoft Excel, a staple in the world of data analysis, offers a powerful suite of tools that can transform raw data into meaningful insights. My journey with Excel began out of necessity during my first job, but it quickly turned into a passion as I discovered its potential. In this blog, I’ll walk you through a sample analysis using Excel, highlighting key features and sharing tips to help you get the most out of this versatile software.
Getting Started with Excel
The first step in any data analysis project is entering and organising your data. Excel’s grid-like interface makes it easy to input data and keep it organised. Let’s start with a simple dataset.
Sample Dataset: Exam Scores
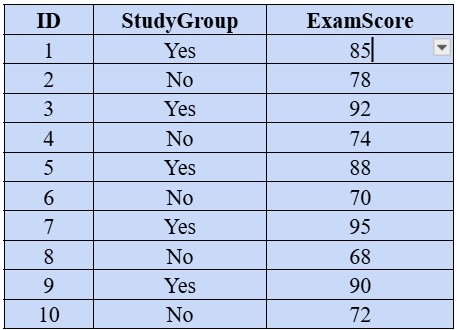
Consider the following dataset of student exam scores, where we want to determine if there is a significant difference in scores between students who attended a study group and those who did not.
Step 1: Data Entry
- Open Excel and enter the data into three columns: ID, StudyGroup, and ExamScore.
- Ensure each column has a header, as this will help when creating tables and charts.
Step 2: Descriptive Statistics
Excel has built-in functions to calculate basic descriptive statistics such as mean, median, and standard deviation.
- Calculating the Mean:
- Click on a new cell where you want the mean to appear.
- Enter the formula =AVERAGE(C2:C11) and press Enter. This will calculate the mean of the exam scores.
- Calculating the Standard Deviation:
- Click on a new cell for the standard deviation.
- Enter the formula =STDEV.P(C2:C11) and press Enter.
Step 3: Data Visualisation
Graphs and charts are essential for visualising data. Let’s create a bar chart to compare the exam scores of students who attended the study group versus those who did not.
- Creating a Pivot Table:
- Select your data range (A1).
- Go to Insert > PivotTable.
- In the PivotTable Field List, drag StudyGroup to the Rows area and ExamScore to the Values area. This will give you the average exam scores for each group.
- Creating a Bar Chart:
- With the PivotTable selected, go to Insert > Bar Chart and choose a clustered bar chart.
- This chart will display the average exam scores for both groups, providing a visual comparison.
Step 4: Hypothesis Testing
To determine if the difference in exam scores between the two groups is statistically significant, we can perform a t-test.
- Performing a t-test:
- Go to Data > Data Analysis (if Data Analysis is not visible, you need to load the Analysis ToolPak add-in from File > Options > Add-ins).
- Select t-Test: Two-Sample Assuming Equal Variances and click OK.
- Enter the ranges for both groups (C2:C6 for Yes and C7:C11 for No).
- Click OK to generate the output.
Step 5: Interpreting Results
The output will include several values, but focus on the p-value.
- If the p-value is less than 0.05, there is a significant difference between the two groups.
Sample Output Interpretation:
Let’s assume the t-test output shows a p-value of 0.002.
Interpretation:
- Since the p-value is 0.002, which is less than 0.05, we conclude that there is a statistically significant difference in exam scores between students who attended the study group and those who did not.
Conclusion
Excel is more than just a spreadsheet tool; it’s a powerful ally in data analysis. From basic calculations and descriptive statistics to visualisations and hypothesis testing, Excel can handle a wide range of analytical tasks. By mastering these tools, you can uncover valuable insights and make data-driven decisions with confidence.
My journey with Excel has been incredibly rewarding. Each new feature I discover opens up more possibilities for analysis. Whether you’re a beginner or an experienced analyst, Excel has something to offer. So, dive in, explore its features, and let your data tell its story.
If you or your friend is looking for help with academic writing, then we at SchoolUs have a team of subject matter experts to assist you. We assist students with following:
Leave a Reply